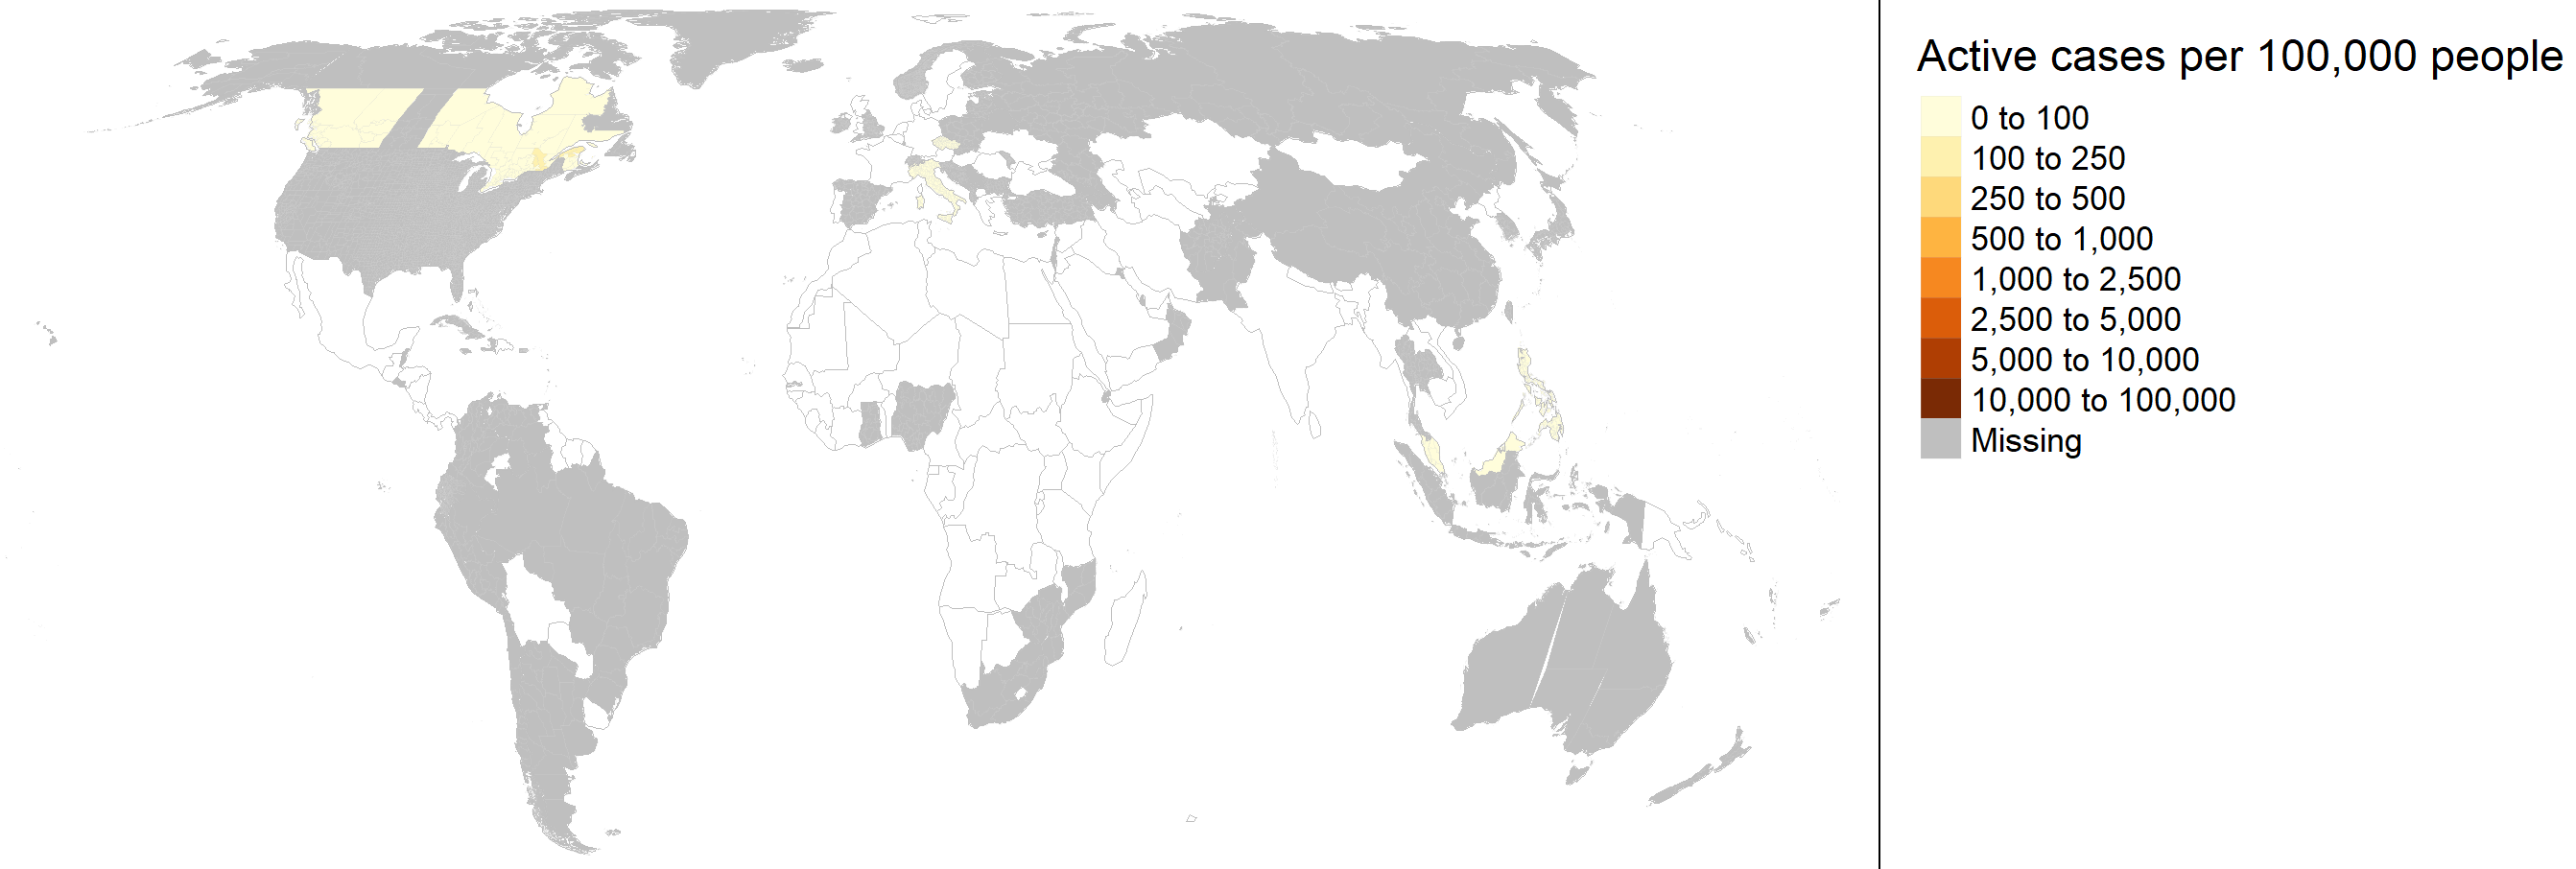
Way back in 2020, during the early phases of COVID-19 pandemic we developed data-driven estimates of exposure risk for events based on group size using US county-level case data which we deployed on a publicly accessible website: covid19risk.biosci.gatech.edu. This project evolved and now represents joint work through a collaboration between our team (previously at Georgia Tech, now at UMD), the Friendly Cities Lab at Georgia Tech, the Applied Bioinformatics Laboratory, and a team of cognitive neuroscientists at Duke University. Using interactive geographic mapping we were able to visually communicate real-time county-level estimates of exposure risk for events of different group sizes in the USA (Chande et al., 2020, Nature Human Behaviour). This work helped translate data representing the number of recorded COVID-19 cases into a metric of potential exposure risk expressed as a percentage, representing the potential that at least one person in a crowd of a certain size is likely to be infectious and expose others to potential disease (Weitz et al., 2020, Scientific American). Later we extended this approach with the release of an R package localcovid19now to help estimate exposure risk at events at subnational spatial scales across multiple countries (Beckett et al., 2023, Journal of Open Source Software). A key aspect of this software was aggregating data from over 40 data sources, requiring tailored approaches to the design aspects of each dataset. Data was released in a multitude of formats (.csv, googlesheets, .json, .zip and more) and data-structures. We also incorporated a modular approach such that failure in one part of the data pipeline (e.g., due to errors/data changes/cyberattacks) did not prevent loading of other datasets.
Previous work from our collaborators (Sinclair et al., 2021, PNAS) showed that individuals are rational and risk-averse with increased intention to act towards reducing risk when perceptions of risk are high. However, this study found that individuals perceptions of potential exposure risk were not aligned with those estimated from our website and that interactive interventions could help to re-calibrate individual risk assessment. In our work we were able to facilitate communicating exposure estimates to the public, but was this communication effective? Our team examined how users engaged, interacted and whether they changed their perceptions of exposure risk using the covid19risk.biosci.gatech.edu website (Sinclair et al., 2023, PLOS ONE), which may be the first study to assess the effectiveness of a COVID-19 dashboard. We found that users tended to overestimate the risk of small events, while underestimating the risk associated with large events. Further, upon receiving feedback users who tended to underestimate risk were more likely to change their willingness to participate in events that might be risky. Using targeted Facebook adverts we explored the effectiveness of different communication strategies across different demographic groups (Sinclair et al., 2023, Journal of Applied Research in Memory and Cognition) finding that message specificity and episodic scenarios increased engagement; and that overall older, liberal adults were more interested in learning about COVID-19 risks.
These works are of their time. Since these efforts began, the majority of public data reporting on COVID-19 has ended. However, I hope these products and efforts will not be forgotten — and can help with preparations for response to future outbreaks. The interdisciplinary collaborations that made these insights and tools possible were crucial, meaningful, and highly worthwhile. Overall, these papers highlight some of the challenges in wrangling and harmonizing public surveillance data, and translating this into products that are both useful and effective at (a) communicating health risks and (b) encouraging actions to reduce disease associated burdens both within and across communities.
Read more in the papers below:
Weitz J.S., Harris M., Chande A.T., Gussler J.W., Rishishwar L., Jordan I.K. Online COVID-19 Dashboard Calculates How Risky Reopenings and Gatherings Can Be. 2020. Scientific American. https://blogs.scientificamerican.com/observations/online-covid-19-dashboard-calculates-how-risky-reopenings-and-gatherings-can-be/
Chande A., Lee, S., Harris M., Nguyen Q., Beckett S.J., Hilley T., Andris C., Weitz J.S. Real-time, interactive website for US-county-level COVID-19 event risk assessment. 2020. Nature Human Behaviour 4: 1313–1319.
Sinclair A.H., Hakimi S., Stanley M., Adcock R.A., Samanez-Larkin G.R. Pairing Facts with Imagined Consequences Improves Pandemic-Related Risk Perception. 2021. Proceedings of the National Academy of Sciences 118(32): e2100970118.
Beckett S.J., Brandel-Tanis F.A., Nguyen Q., Chande A.T., Rishishwar L., Andris C., Weitz J.S. localcovid19now: processing and mapping COVID-19 case data at subnational scales. 2023. Journal of Open Source Software 8(81): 4898.
Sinclair A.H., Taylor M.K., Brandel-Tanis F., Davidson A., Chande A.T., Rishishwar L., Andris C., Adcock R. A., Weitz J.S., Samanez-Larkin G.R., Beckett S.J. Communicating COVID-19 exposure risk with an interactive website counteracts risk misestimation. 2023. PLoS ONE 18(10): e0290708.
Sinclair A.H., Taylor M.K., Davidson A., Weitz J.S., Beckett S.J., Samanez-Larkin G.R. Scenario-Based Messages on Social Media Motivate COVID-19 Information Seeking. 2023. Journal of Applied Research in Memory and Cognition. Advance online publication.

